Reviewing Google’s Deep Review: Figure Hallucinations & Output Variance Make it Borderline Unusable
- Hallucinations and Output Variances
- Paper one: One report, Multiple Fabrications
- Seperate Reviews of Same Paper: Divergences
- The mutagenesis panel: two reports, two different errors
- What Held Up?
- Astoudning Variance Problems
- Why Only Figures Lead to Errors, Specifically?
- How to actually use Google Deep Review?
- Open Questions
- No Replacement for a Human Reviewer Yet
Reachout to Researchers with Our Extensive Marketing Network
Modern scientific marketing partner built for life science brands



Google announced the public release of its scientific AI reviewing tool for researchers yesterday with 2 free paper reviews per-week for everyone. We found major issues in a tool that apparently has undergone extensive development and training with tests on more than 16,000 manuscripts at four of computer science’s largest conferences.
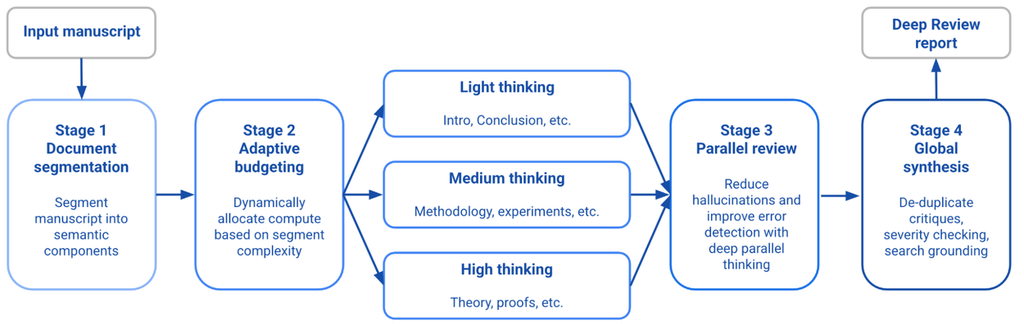
Deep Review is an agentic system that takes a technical document and returns a full spectrum verification report that a skilled reviewer would give: logical gaps, unsupported claims, inconsistencies between sections, mathematical errors. It began as the internal Paper Assistant Tool (PAT), described in an arXiv preprint in June, and has since widened from computer-science papers to legal, finance, design and presentation documents.
Hallucinations and Output Variances
Google Deep Review launched with a detection-rate figure and no false-positive rate. Nobody in this category publishes one. So we measured a proxy: we took three Deep Review reports across a two bioRxiv preprints and checked every verifiable claim against the source — exact quotes, page attributions, equation numbers, multi-decimal parameter values, arithmetic, and statements about what specific figure panels display.
Four findings, stated up front.
- Every error was a claim about what a figure panel visually contains: which names sit on an axis, which rows a bar chart holds, what a bar is annotated with, which curve is flat.
- Fabricated numbers are then reasoned: Three of the four most elaborate statistical critiques across these reports rest on sample sizes that do not exist in the papers. The arithmetic downstream is correct. Nothing inside the reports signals a problem, because everything inside them is consistent with what was perceived.
- Two runs on the same paper produced the same wrong number: Agreement between runs is not evidence of correctness.
- No errors came from body text, captions, equations, methods prose or arithmetic: Across all three reports those claims were correct, including values quoted to eight significant figures and multi-step derivations the papers never spell out.
Paper one: One report, Multiple Fabrications
The first subject was a 51-page synthetic biology preprint on high-throughput genetic-circuit screening (bioRxiv 10.64898/2026.10.11.758309). The report makes roughly 50 independently checkable assertions. Three are outright fabrications and two more are unsupported.
Two invented fluorescent proteins. The report states that “two of the four fluorescent reporters (mChartreuse and mLychee) are identified only in the axis labels of Supplementary Figs. S1 and S2.” The four reporters are mVenus, mLemon, mJuniper and SCFP3A. There is no mChartreuse and no mLychee anywhere in the paper.
This is the most instructive error we found. The structural observation is correct — two reporters genuinely appear only in supplementary axis labels and never in the main text. The report identified a real gap, then filled it with plausible-sounding names in the exact register of real fluorescent-protein nomenclature. A reader unfamiliar with the FP literature cannot catch this; a reader who knows it may assume they missed a variant.
A figure omission that does not exist. The report says genotype AS22t is missing from a supplementary panel’s y-axis, leaving 11 genotypes and four grey zeros. AS22t is present; the panel shows all twelve; there are five grey zeros, matching the caption’s own “Five gray zeros”; and one genotype the report lists as a zero carries a positive integral. The report then asks the authors to resolve a discrepancy that is not there.
A rounding collision and an ordering error, both invented. The report claims two genotypes in the same panel share a rounded 0.04h label and are drawn in a particular order. They display 0.04 and 0.03 — no collision — and the ordering is the reverse of what the report states.
The two unsupported claims follow the same shape: a correct catch with a fabricated illustration bolted on. The report is right that one parameter is undefined at first use and missing from a supplementary table, then invents a contrast with another symbol that is also missing. It is right that one heatmap uses nominal rung order while another uses calibrated activity — the supplement says so explicitly — then supports it with a ladder ordering that runs backwards.
Seperate Reviews of Same Paper: Divergences
The second subject was a de novo enzyme-design preprint (bioRxiv 10.64898/2026.10.01.756017) submitted twice, from two separate accounts. We call the resulting reports A and B. They contradicted each other on five readings of the same figure panels. With the source in hand, every contradiction resolves — and the answer is not that one report was right.
Figure 4 annotates each bar with a grey hit fraction. These are raster content, absent from the PDF text layer, so we rendered the page at 400 dpi and cropped the charts. They read unambiguously.
| Panel cell | Actual | Report A | Report B |
|---|---|---|---|
| 4D, all data (Kemp eliminase) | 179/1521 | 119/1021 ✗ | “1,521 tested” ✓ (denominator only) |
| 4D, best tested filter | 37/148 | not cited | not cited |
| 4D, best retrospective filter | 6/10 | 3/5 ✗ | 12/20 ✗ |
| 4E, all data (serine esterase) | 113/1524 | 111/1524 ✗ | 100/1524 ✗ |
| 4E, best tested filter | 23/68 | not cited | 99/294 ✗ |
| 4E, best retro. filter, kobs | 11/21 | 12/23 ✗ | 12/23 ✗ |
| 4E, best retro. filter, hit rate | 4/5 | 4/5 ✓ | 4/5 ✓ |
Whats behind the headline claim : The best retrospective filter for Kemp eliminases — the cell supporting the paper’s headline 60% figure — reads 6/10. Report A read 3/5. Report B read 12/20. Both preserve the ratio exactly: A halved the counts, B doubled them, and the percentage stayed right while the sample size went wrong.
Each report then reasoned impeccably from its own invented number. Report A computed an exact Clopper–Pearson interval of 14.7%–94.7% from n = 5 and built an argument about sparse-tail instability on it; the correct interval for 6/10 is roughly 26%–88%. Report B computed a 1.3% retention rate from 20 of 1,521; the true retention is 10 of 1,521, or 0.7%. Both are also internally consistent — A’s stated pass rate matches its own n, B’s matches its own — which is precisely why neither report flags itself.
Both runs produced the same wrong number (Consistently incorrect, a positive?): The kobs filter cell reads 11/21. Report A read 12/23. Report B read 12/23. Two runs, two accounts, the identical fabricated fraction, which also happens to round to the correct 52%. This matters for anyone tempted to use repeat runs as verification: it does not work. Any overlap statistic computed across runs includes shared errors.
The argument that inverted its own data: Report B’s most elaborate claim in this section reads: “99 of the 100 total active serine esterases in the entire dataset have N_MR = 10/10, leaving only 1 active hit among the remaining 1,230 designs.” The actual figures are 113 total hits, of which 23 sit in the best-tested cohort of 68 — so 23 of 113, leaving 90, not one. B’s conclusion, that the retrospective analysis is circular because nearly every hit already carries a perfect score, is the opposite of what the panel shows. The argument is coherent, specific, and built on two numbers that are not in the paper.
The mutagenesis panel: two reports, two different errors
The knockout panel shows one consistent pattern across both lead designs: the catalytic-base knockouts are abolished, and the oxyanion-hole knockout retains roughly a third of activity (~250 µM against ~750 µM unmutated).
| Mutant | Actual | Report A | Report B |
|---|---|---|---|
E129A, E129Q (base) | abolished | “leaves measurable turnover… ~200 µM” ✗ | “completely abolishes” ✓ |
N63A (oxyanion hole) | retains ~33% | “40–70%” ~✓ | “~45%” ✓ |
D44A, D44N (base) | abolished | “leaves measurable turnover” ✗ | “~120–160 µM product” ✗ |
Y92A (oxyanion hole) | retains ~33% | “40–70%” ~✓ | “abolishes activity” ✗ |
Report A invented residual activity for the base knockouts in both designs, including a specific “~200 µM.” Report B read the first design correctly, then inverted the second — swapping which residue retains activity — with its own invented “~120–160 µM.”
Both reports then asked the authors to explain a mechanistic anomaly. In A’s version the anomaly sits in one enzyme; in B’s it sits in the other. Neither exists. The paper’s own text states plainly that five of ten mutants were abolished and the rest reduced, which is exactly what the panel shows. An author acting on either report would have gone looking at a different residue in a different protein.
What Held Up?
Every quoted passage, with correct page attribution — verbatim quotes from captions, supplementary prose and methods sections, across all three reports.
Every numeric value drawn from text or tables. From the first paper: γ = 1.4853154 h⁻¹ and its 0.999γ bound of 1.4838301 h⁻¹; a correction factor given as 1/2.5945 = 0.38544 “not the nominal 0.4”; a stress threshold of 0.11754; reporter ceilings of ~76,800 and ~10,200; a count of 1,172 constructs that appears nowhere in the main text. From the second: all design and cluster counts, every kinetic parameter, a 0.079-versus-0.08 rounding mismatch between a table and its text. This is something great the google has pulled off, avoiding hallucinations where it matters.
All the arithmetic, including detection thresholds of 1.96/√22 = 0.418 against 1.96/√38 = 0.318, correctly stated as ~31% higher, and a triangular-taper attenuation range whose four endpoints all check out. One report went further: it reconstructed a controller-responsiveness expression matching the supplement exactly, derived a threshold condition the paper does not state, and used it to identify a genuine theoretical tension in the authors’ interpretation. That is real work.
Several unique findings are valid and sharp. Report A alone caught that a T₅₀ assay measures activity after cooling, so it demonstrates resistance to irreversible inactivation rather than catalysis at temperature — a real limitation, confirmed in both text and caption. Report B alone caught a design carrying ±220 M⁻¹s⁻¹ on kcat/KM, a 0.49% relative error against 7.5–19% everywhere else in the same table. Both flagged a reference enzyme plotted in a thermostability panel and named nowhere in the text, caption or reference list — it is there in the legend, and genuinely unexplained.
Citation handling is sound. Both reports on the second paper ran a citation checker over the same 77-entry bibliography and flagged nothing. Every external reference either report cited when recommending comparisons is real, correctly titled and correctly attributed — one title is missing a hyphen and carries the wrong year, and that is all. The fabrication risk here lies elsewhere.
Astoudning Variance Problems
Counting at the level of distinct substantive concerns, the two runs on the second paper overlapped about half the time:
| Count | |
|---|---|
| Raised in both reports | ~29 |
| Only Report A | ~9 |
| Only Report B | ~20 |
| Union across both runs | ~58 |
| Overlap | ~50% |
Minor typographical corrections overlapped more, around 60%, which fits: typo-finding is closer to deterministic, analysis is not. Even the citation checker’s bookkeeping moved — 74 checkable entries and 3 skipped in one run, 76 and 1 in the other, from an identical bibliography.
A false positive is a cost you can pay by checking. Instability is a cost you cannot design around. If the same manuscript returns substantially different major issues on a second pass, then “Deep Review found X” is a statement about that run, not about the paper. A journal cannot use it for triage; two editors submitting the same manuscript get different reports. An author cannot read a clean report as evidence of anything, because whatever the other run would have found is still in the file. And the obvious workaround — run twice, take the union — inherits every fabrication both runs happened to share. We have one measured instance of exactly that.
Why Only Figures Lead to Errors, Specifically?
The issue is not new to Google or to the overall AI review industry. Deep Review’s own documentation lists PDF parsing among the tool’s known problems, NeurIPS warned pilot participants that it may flag correct statements, and Google’s preprint concedes that the Pass@k scaling the architecture depends on “significantly degrades precision,” crediting a synthesis agent with counteracting it without publishing a measurement.
The independent SPOT benchmark remains the only public precision figure in this category: 83 papers, 91 retraction-grade errors, eight runs per model, best precision 6.1% against 21.1% recall, with models rarely rediscovering the same errors between runs and full confidence recorded in 2 of 498 evaluations. Deep Review’s headline is a recall improvement on the benchmark built to expose precision.
What our audit adds here is the shape of the failure. The model does not hedge and does not produce noise. It produces a specific, plausible number or name, then reasons from it with real rigour — and the rigour is what makes it dangerous, because a well-constructed statistical argument reads as evidence that the input was checked.
How to actually use Google Deep Review?
- Act on text, quote, table and equation findings. They were reliable across every report we audited, including values to eight significant figures.
- Open every figure a finding refers to. Treat the claim as a pointer to a panel, never as a reading of it.
- Discount any statistical argument built on a figure-derived sample size until you have checked the denominator yourself.
- Do not treat agreement between runs as verification. Both runs here produced 12/23 for a cell that reads 11/21.
- Run it more than once anyway. Two runs found ~58 distinct concerns where one found ~38. That is a real gain, and also an admission that single-run output is not a finished review.
Open Questions
- Why is no false-positive rate published? Deep Review, Reviewer3, q.e.d and the publisher-side tools all report what they catch. None reports what they invent. On our evidence the second number is the one that determines whether the tool is usable.
- Is figure misreading a parsing failure or a reasoning failure? If it is OCR and raster extraction, it is fixable with better ingestion. If the model is confabulating panel contents to complete an otherwise-correct structural observation — which is what the invented protein names look like — that is harder.
- Does the synthesis agent reduce precision loss or hide it? It is credited with counteracting Pass@k degradation. An unmeasured correction applied to an unmeasured error is not a result.
- Why do shared hallucinations happen at all? Two independent runs converging on 12/23 suggests the misreading is systematic rather than stochastic — which would make it reproducible, and in principle measurable.
- What is the error rate on figures specifically? Every published number in this category is computed over whole papers. On this evidence the relevant denominator is figure-derived claims, where our observed accuracy was 3 of 10.
No Replacement for a Human Reviewer Yet
Google credits Gemini 4 Argon for improved capability but does not say which model runs which stage or at what difficulty. Google API is required for addtional reviews with token usage depending on the difficulty of the review. There is also a Teamwork Deep Document Review Pattern built on Google’s Teamwork multi-agent framework, available in Antigravity via /teamwork-preview. A Gemini API key also unlocks the Deep Review API for programmatic use, including CI pipelines.
Google states uploaded documents are not used to train, fine-tune or improve its models, and are retained for one year solely to display them back to the user. That is a clearer commitment than most of this category offers, and it matters, because the central objection to AI review is confidentiality.
Google’s Rajesh Jayaram and Vincent Cohen-Addad announced public availability on 14 October 2026. While late into the AI Reviewer , it is the most credible entrant yet in a category that now has at least four distinct business models — and the one most likely to force the others to pick a lane. However, we wouldn’t recommend you to trust Deep Review blindly just yet. It competes with Reviewr3, Q.E.D Science and others who have been around for the past half a year or more and have been assisting researchers in preliminary research.
From scientific publishing to coding, we are currently facing a validation bottleneck: generative AI has made mass producing documents dramatically cheaper while leaving the capacity to check them flat. Even before the advent of AI, there was and always the issue of finding expert reviewers for research papers. Submissions to ICLR, NeurIPS and ICML passed 74,000 in 2026, against roughly 45,000 in 2025, 32,000 in 2024 and 23,000 in 2023 — a tripling in three years, with no matching increase in qualified reviewers. Whether or not you accept Google’s solution, that curve is the single most important fact in scholarly publishing right now.